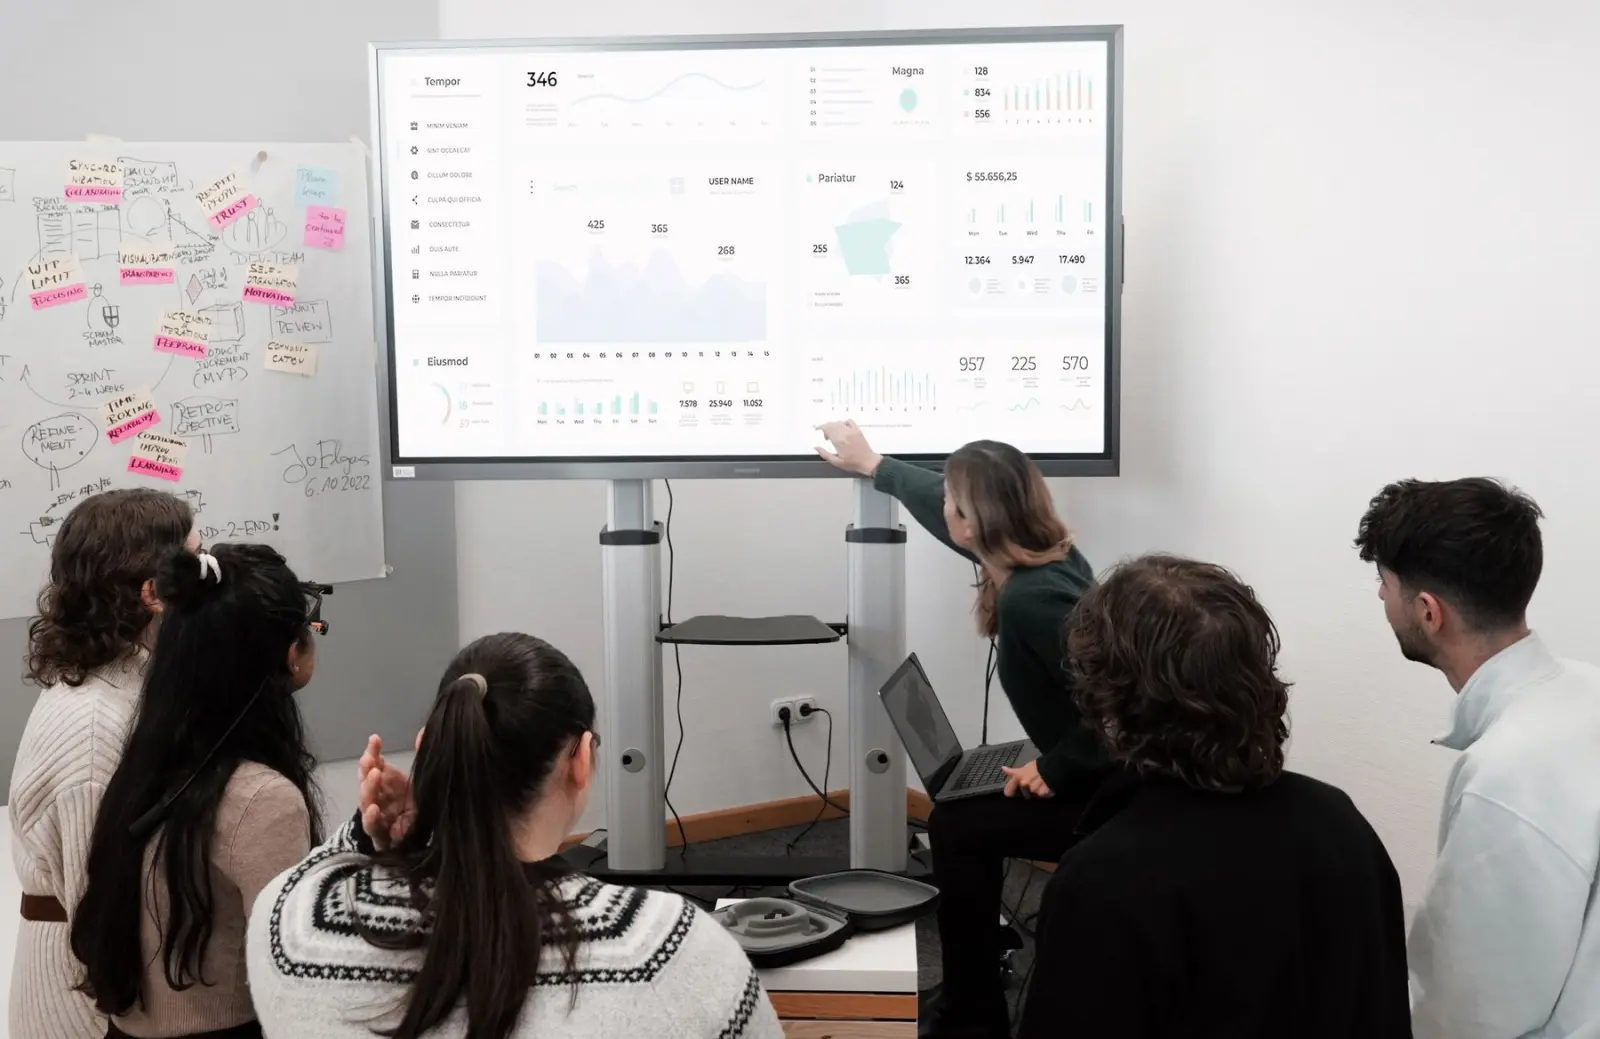
A right-sized observability setup for a small SaaS team: structured logs, the metrics that matter, tracing with OpenTelemetry, SLOs and alerts that do not burn people out.
In this article
- 01Why a small team needs observability early
- 02Logs: structured, correlated and affordable
- 03Metrics: the numbers that summarize health
- 04Traces: following one request through the system
- 05Choosing tools without overspending
- 06Health checks and synthetic monitoring
- 07Background jobs and queues
- 08Define what good looks like with SLOs
- 09Alerts that people will not ignore
- 10Dashboards worth having
- 11On-call and incidents for a team of five
- 12A starter checklist
Why a small team needs observability early
In a small SaaS, the first sign of trouble is often a customer email. By then the issue has been live for a while, and the team has to guess what went wrong. Good monitoring flips that: you see problems first, and when something breaks, the data to diagnose it is already there.
Monitoring tells you whether known things are healthy. Observability is the broader ability to answer new questions about your system from the data it emits, such as why one customer's requests are slow. Both rest on the same signals: logs, metrics and traces, plus alerts that turn them into action. The goal for a small team is a setup that is useful on day one and cheap to maintain.
Logs: structured, correlated and affordable
Write logs as structured JSON, not free text, so you can filter and aggregate them. Every log line from a request should share a request ID, and the tenant ID and user ID where relevant, so you can follow one request across services. Use levels consistently: errors for things that need attention, warnings for unexpected but handled events, info for key business events and debug only when temporarily needed.
- Never log passwords, tokens, card numbers or full personal records
- Log the outcome of important actions, such as a payment succeeded or an export finished
- Set retention by value: keep detailed logs for days or weeks, not forever
- Sample noisy, low-value logs instead of paying to store all of them
Metrics: the numbers that summarize health
Metrics are cheap numeric time series, ideal for dashboards and alerts. For each service, start with the RED method: rate (requests per second), errors (failed requests) and duration (latency, as percentiles such as p95 and p99, never only averages). For infrastructure such as databases, queues and servers, use the USE method: utilization, saturation and errors.
Add a few business metrics too, such as sign-ups, successful payments and active jobs. A sudden drop in successful payments is often the earliest sign of a broken integration, even when every technical metric looks normal.
Traces: following one request through the system
A trace records the path of a single request through your services, with timed spans for each step: the API handler, database queries, cache calls and outgoing HTTP requests. Traces answer questions that logs and metrics struggle with, such as which of seven calls made this page slow.
OpenTelemetry is the vendor-neutral standard for traces, metrics and increasingly logs. Its SDKs and auto-instrumentation libraries cover common frameworks, and context propagates between services through the W3C traceparent header. Instrument once with OpenTelemetry and you can switch or combine backends later without touching application code.
Choosing tools without overspending
A small team has two broad options. A hosted platform such as Datadog, New Relic, Honeycomb or Grafana Cloud gives you everything quickly but costs grow with data volume. A self-hosted stack, such as Prometheus for metrics, Loki for logs, Tempo for traces and Grafana for dashboards, costs less in fees but more in time. Add an error tracker such as Sentry, which groups exceptions with stack traces and release information, and an external uptime checker that tests your public endpoints from outside your infrastructure.
- Start hosted unless you already run observability tooling
- Watch ingestion volume monthly, since logs usually dominate the bill
- Sample traces, keeping all errors and slow requests but only a fraction of normal ones
Health checks and synthetic monitoring
Give every service two endpoints: a liveness check that only confirms the process is running, and a readiness check that confirms it can serve traffic, including connections to essential dependencies. Load balancers and orchestrators use these to route traffic and restart failed instances.
Internal checks cannot see what users see. Add synthetic checks that run from outside your infrastructure every minute or two: load the sign-in page, call a public API endpoint and, if possible, run a scripted sign-in with a test account. They catch expired TLS certificates, DNS mistakes and broken CDN configuration that internal metrics miss.
Background jobs and queues
Background work fails quietly. A stuck email queue or a scheduled billing job that stopped running can go unnoticed for days because no user request fails. Track queue depth and the age of the oldest message, record the success, failure and duration of each job type, and alert when a scheduled job has not completed within its expected window. A simple heartbeat, where each job reports when it finishes and an alert fires if the report is late, covers most cases.
Define what good looks like with SLOs
A service level objective (SLO) states a target for the user experience, such as 99.9% of API requests succeeding within 500 milliseconds over 30 days. The gap between the target and perfection is the error budget. When the budget is healthy, ship features; when it is burning fast, prioritize reliability. SLOs give a small team an objective way to make that trade-off.
Keep SLOs few and user-centered: sign-in, the main workflow and payments. Internal SLAs promised to customers should be looser than your SLOs, so you notice problems before they become contractual breaches.
Alerts that people will not ignore
Alert fatigue is the most common failure in small-team monitoring. If alerts fire often and need no action, people stop reading them, and the real one gets missed. Follow a few rules:
- Page only for symptoms users feel, such as high error rates or a fast error budget burn, not for every high CPU reading
- Send non-urgent issues, such as a disk filling slowly, to a ticket or chat channel instead of a page
- Every alert links to a runbook explaining what to check first
- Review alerts monthly and delete or tune any that fired without needing action
Dashboards worth having
Build a small number of dashboards with a clear purpose. A service overview shows RED metrics per endpoint and recent deployments. A dependency view shows database, cache and queue health. A business view shows sign-ups, payments and active users. Mark deployments on graphs, because the most common cause of a sudden change is a recent release.
On-call and incidents for a team of five
Even a tiny team needs a clear answer to who responds at 3 a.m. Rotate on-call weekly, keep a shared incident channel and a simple status page, and write a short blameless review after significant incidents: what happened, how it was detected, what fixed it and what will prevent it. Our incident management explainer covers the process.
Use multi-tenant context in every signal. When one customer reports a problem, being able to filter logs, traces and metrics by tenant ID turns hours of searching into minutes.
A starter checklist
If you are starting from nothing, this order gives the most value fastest: error tracking, uptime checks, structured logs with request IDs, RED metrics with a service dashboard, two or three symptom-based alerts with runbooks, then tracing and SLOs. Nexzem's managed cloud services and DevOps consulting include setting up this kind of stack for growing products.